TLDR
This is Part 2 of my series on an AI-assisted stock trader. Refer to Part 1 to get more information on the requirements for a Q-Learner, though I will give a brief introduction anyway. A Q-Learner is a type of reinforcement learning algorithm to find the optimal strategy based on its environment. It requires an action, a state, and some reward for taking an action (reward can be positive to encourage an action, or negative to discourage an action).
This post will apply Part 1’s general tips to the context of trading.
The Process
For our learner, technical analysis indicators will be used to predict future prices. We will loop multiple times through each day in our training data. A matrix of these indicators will be sent to our discretization function, returning an integer representing the state of the market for each day in our training data.
Here is some pseudocode that generalizes this approach:
while learner not converged on an optimal policy:

	for each day:
		get indicators for today
		state = discretize the indicators
		reward = calculate the reward for trading today
		action = query(state, reward) the learner

		if the leaner signals a buy action:
			if we're currently short, go long
			if we're not in the market, enter market at 1,000 shares long
		else if the learner signals a sell action:
			if we're currently long, go short
			if we're not in the market, enter market at -1,000 shares short
		else
			exit the market (return holdings to 0 shares)
The outer while-loop controls convergence. A learner will converge on an optimal policy once the actions taken by the learner for similar states stabilizes. This suggests that the learner has found consistent rewards for its actions. Once the learner converges, we can then use the policy it has learned to make trading decisions (hopefully it learns well… 🤞).
Indicators
The success of this project hinges on the learner’s ability to analyze market indicators to make the best trading decision possible. We will discretize three indicators: momentum1, Bollinger Bands %B (BBP)2, and moving average convergence/divergence (MACD)3 so our learner can assess market conditions and make trading decisions.
Since these are all momentum indicators, we will be employing a momentum-based trading strategy that goes long when momentum is increasing, and short when momentum is decreasing.
Strategy Comparisons
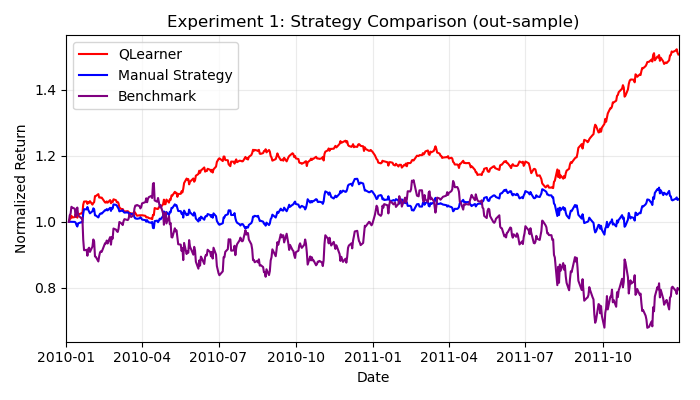
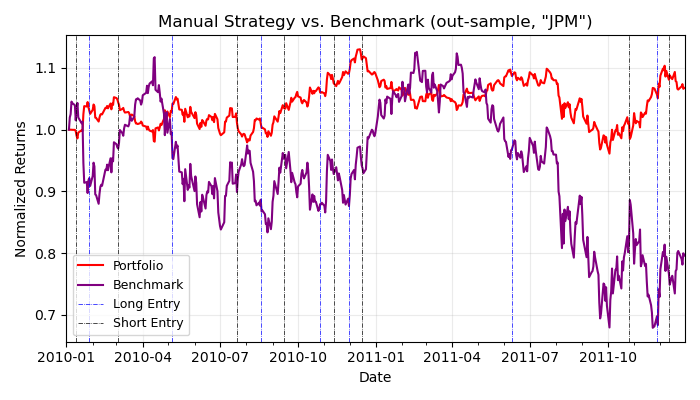
To gauge the effectiveness of each strategy, two additional strategies will be used as a comparison for the Q-Learner’s results. The first is a benchmark strategy, which consists of buying 1,000 shares of JPM stock on day one and holding this position for an entire 2-year period. The next is a manual strategy, which involves myself hardcoding threshold values given the raw indicator data, and then making trade decisions based off these thresholds.
Ideally we should expect both the manual strategy and Q-Learner to outperform the benchmark, though we should expect the greatest return from the Q-Learner strategy, as it should learn nuanced indicator interaction that is definitely not obvious to myself!
Results
Training the learner for 15 epochs shows exceptional results against the manual strategy and benchmark.

Returns are based on cumulative returns, calculated by dividing the return on day 1 by the return on the last day of the 2-year period.
This means the learner has picked up on some market interactions that I’ve overlooked.
How do they trade?
I’ve also included a plot showing the number of trades generated by my manual strategy versus the Q-Learner.

It’s interesting to see that my strategy made significantly less trades, though still performed reasonably well against the learner.

This suggests that making small, incremental transactions can be beneficial in this context. Though, these results are not taking transaction costs into account! This is significant because making a large number of trades over time diminishes overall returns. We will focus on two: market impact and commission as our transaction costs. So, we need to modify our reward function to discourage the learner based on the market impact.
Conclusion
In this post, we covered some basic momentum indicators to gauge market impact, and how to use them in a Q-Learner strategy. We then compared results to show that the Q-Learner is capable of picking up on nuanced momentum shifts. In the next and final part, we will explore the effects of transaction costs on the Q-Learner strategy.
References
If you’re interested, here is more information on the indicators used in this project:
